Central anchor7/13
Fractal
Through Fractal: What survives when shapes change, and which rules divide one world from another?
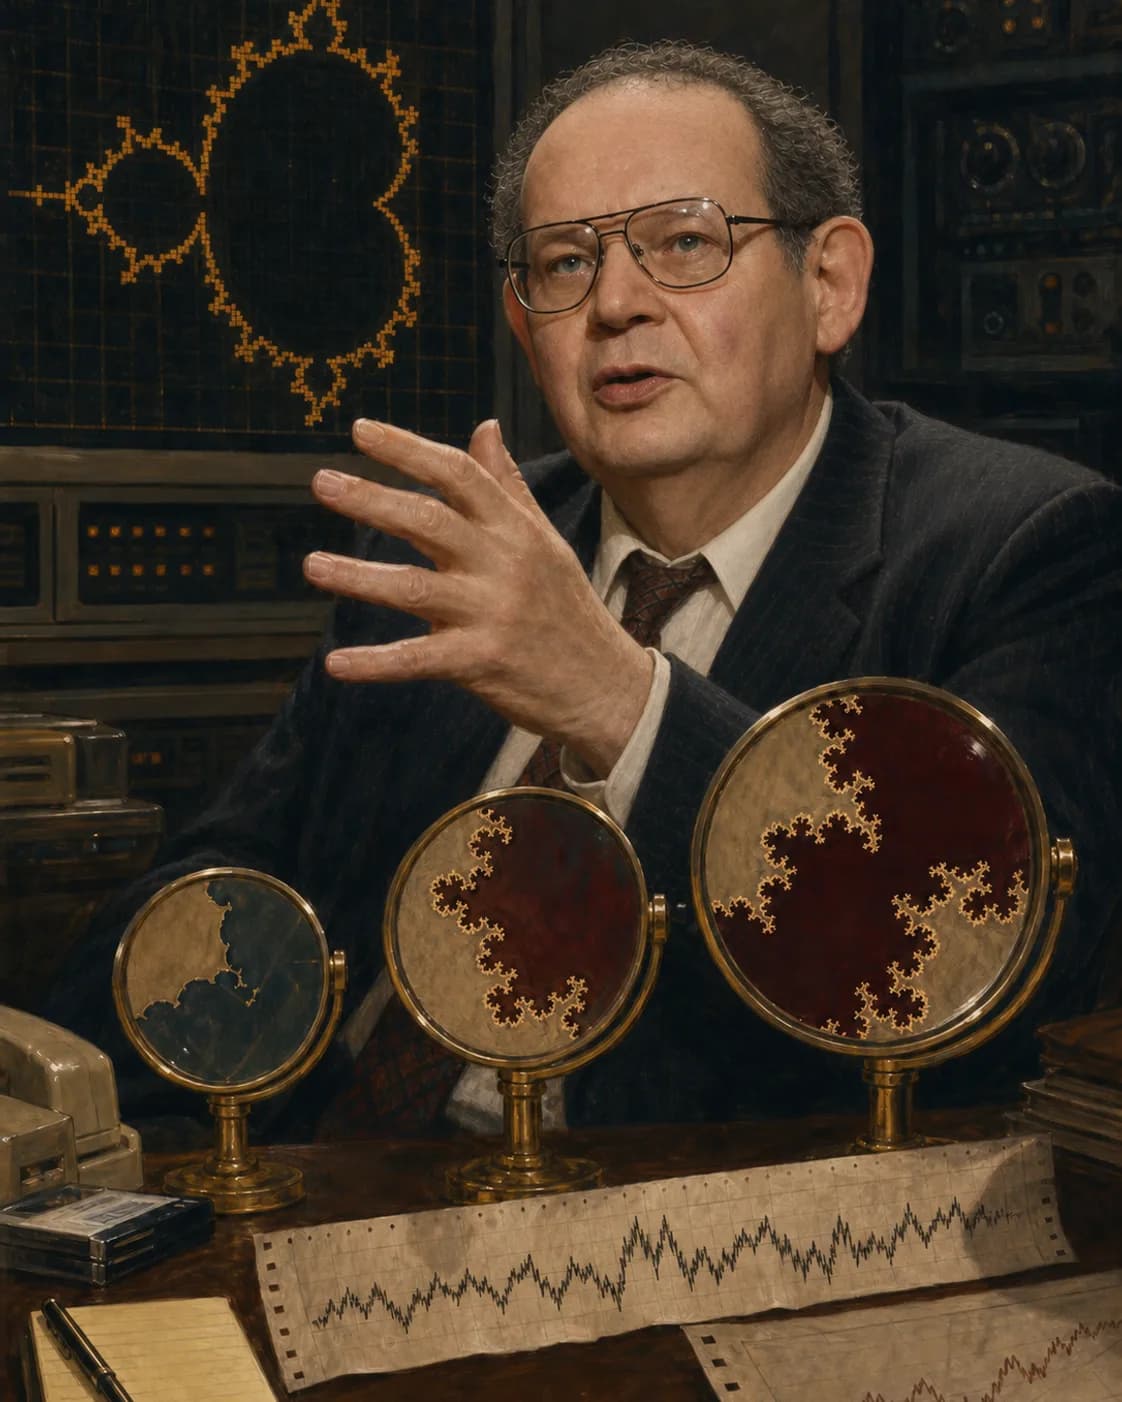
Making the roughness that smooth models erased into mathematics
Durable cues from a known later photograph are re-aged toward about 50 in the late 1970s. The scale frames, coastline, raster, and signal join work from different periods. They do not claim Mandelbrot invented every fractal or that natural forms are exact mathematical fractals at every scale.
MathVoyage editorial direction · OpenAI image generation · historical photograph identity reference · age correction · 2026-08-07
Remember the mind, not only the dates
The idea to carry forward
Clouds are not spheres, mountains are not cones.Enter through one scene
Across communication noise, price data, and geometry, he compared how irregularity changes with scale in very different kinds of data.
Questions this person helps open
These are reverse projections of existing editorial routes, not claims of direct influence or sole invention.
Through Fractal: What survives when shapes change, and which rules divide one world from another?
PROFILE 02 · DEEP VOYAGE
Instead of memorizing more dates, follow the world that shaped this mind, the scenes that changed its direction, and the questions carried onward.
CHAPTER 01 · PERSON AND PERIOD
Before the finished achievement, read what this person treated as a problem and where the surviving evidence reaches its limit.
A mathematician who turned scale-dependent complexity into a common question across several fields. Born in Warsaw, Mandelbrot moved with his family to France in 1936. War severely disrupted his schooling, but he later studied at the École Polytechnique and elsewhere. His 1967 paper revisited Lewis Fry Richardson’s coastline data and asked how measured length changes with yardstick size. In an ideal fractal model with dimension above one, length can diverge as scale tends to zero, but this is not a proof that every physical coastline is literally infinite. At IBM he studied communication noise, price variation, and geometric repetition, introducing the word “fractal” in 1975. The term is a tool for comparing irregularity and scale dependence, not a claim that all natural phenomena obey one self-similar law. Around 1980 he used computer images to study the parameter set of z↦z²+c, helping make complex dynamics broadly visible.
CHAPTER 02 · TURNING SCENES
Follow the moments when the idea moved one step further. Every scene continues through an evidenced place or an honestly labelled time context.
Scene 1 / 4
Across communication noise, price data, and geometry, he compared how irregularity changes with scale in very different kinds of data.
Scene 2 / 4
He interpreted Richardson’s measurements through a scaling law. The rate at which length grows as the ruler shrinks suggests a noninteger dimension.
Scene 3 / 4
From the Latin fractus, he named a research program comparing scale structure across irregular sets and processes. Not every fractal is exactly self-similar.
Scene 4 / 4
He studied images of parameters c whose orbits under z↦z²+c remain bounded, expanding a new culture of exploration built on earlier complex dynamics and computer images.
THOUGHT EXPERIMENT · NOT A FACT CLAIM
This is a thought experiment about influence, not a verified historical fact.
Beginners measure the same jagged line with large and small rulers. Intermediate learners calculate the similarity dimension of the Koch curve. Advanced learners explore Hausdorff dimension and the escape condition for z↦z²+c. Experts test rigorous dimension theory and multifractal models against the finite scales available in real data.
Curated sources and problems. Bring one discovery back from OEIS, Project Euler, MathOverflow, or arXiv.